ECG signs of myocardial infarction: pathological Q-waves & pathological R-waves
Pathological Q-waves are evidence of myocardial infarction
Myocardial infarction – particularly if extensive in size – typically manifests with pathological Q-waves. These Q-waves are wider and deeper than normally occurring Q-waves, and they are referred to as pathological Q-waves. They typically emerge between 6 and 16 hours after symptom onset, but may occasionally develop earlier. Standard textbooks have traditionally taught that the pathological Q-wave is a permanent ECG manifestation and that it represents transmural infarction (STEMI). However, recent studies challenge these notions. Pathological Q-waves may resolve in up to 30% of patients with inferior infarction. The amplitude of Q-waves may also diminish over time. Moreover, magnetic resonance imaging has suggested that pathological Q-waves may also arise due to extensive subendocardial infarction (NSTEMI).
If pathological Q-waves occur as a result of myocardial infarction, the infarction may be classified as Q-wave infarction (this has negligible clinical implication). Hence, Q-wave infarctions are mostly the result of transmural infarction (STEMI) but may be caused by extensive subendocardial ischemia (NSTEMI).
Establishing a diagnosis of Q-wave infarction requires that pathological Q-waves be present in at least two anatomically contiguous leads. In patients with STEMI, ST-segment elevations and pathological Q-waves occur in the same leads, which is why pathological Q-waves can be used to localize the infarct area.
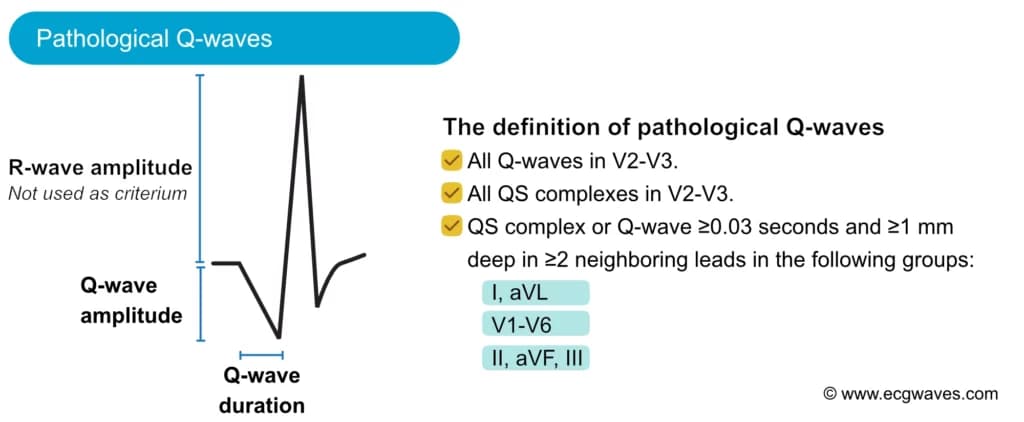
Figure 1. Definition of pathological Q-waves.
ECG criteria for pathological Q-waves (Q-wave infarction)
| Lead | Definition of pathological Q-wave | Normal variants |
|---|---|---|
| V2–V3 | ≥0,02 s or QS complex* | None |
| All other leads | ≥0,03 s and ≥1 mm deep (or QS complex) | Individuals with electrical axis 60–90° often display a small q-wave in aVL. Leads V5–V6 often display a small q-wave (called septal q-wave, explained in this article). An isolated QS complex is allowed in lead V1 (due to missing r-wave or misplaced electrode). Lead III occasionally displays a large isolated Q-wave; this is called a respiratory Q-wave, because its amplitude varies with respiration. Lead III may also display small Q-waves (not related to respiration) in individuals with electrical axis -30° to 0°. |
*QS complex implies that the entire QRS complex is comprised of one negative deflection.
The following figure shows pathological Q-waves in two patients with acute STEMI.
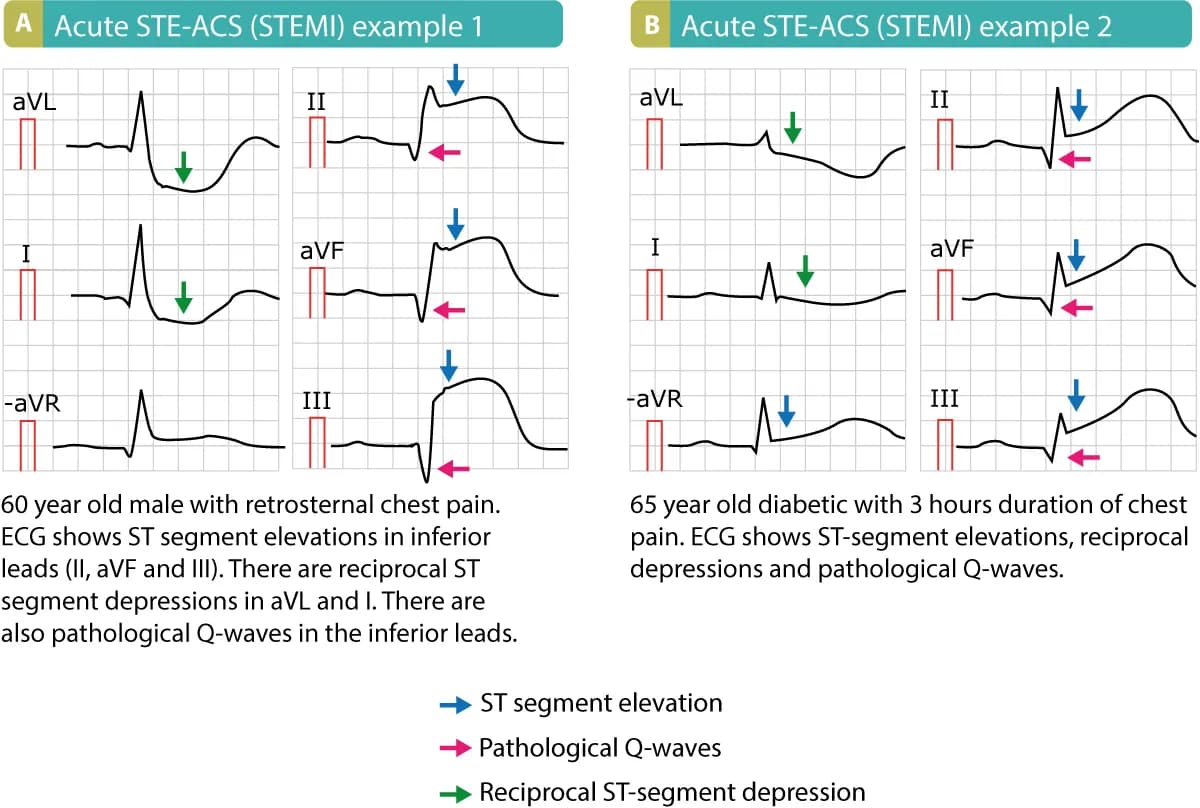
Figure 2. Examples of STE-ACS (STEMI). Note that these patients presented with pathological Q-waves, which means that these ECGs were recorded several hours after symptom onset or those are signs of old infarction.
Pathological R-waves also indicate previous myocardial infarction
Current European (ESC) guidelines suggest that R-waves may also be used to diagnose previous myocardial infarction.
Criteria for pathological R-waves:
R-wave ≥0,04 s in V1-V2 and R/S ratio ≥1 with concordant positive T-wave in absence of conduction defect.
R/S ratio > 1 implies that the R-wave is larger than the S-wave.
ECG manifestations of left main coronary artery (LMCA) occlusion and critical stenosis
Left main coronary artery LMCA occlusion is a rare but catastrophic manifestation of acute coronary syndromes. The LMCA supplies a large myocardial…
Other ECG changes in ischemia and infarction
Normal R-wave progression implies that the R-wave amplitude increases gradually from V1 to V5 and then diminishes again in V6. Refer to Figure 1. Abnormal…