The T-wave: physiology, variants and ECG features
Published 2018-08-22
The normal T-wave
Assessment of the T-wave represents a difficult but fundamental part of ECG interpretation. The normal T-wave in adults is positive in most precordial and limb leads. The T-wave amplitude is highest in V2–V3. The amplitude diminishes with increasing age. As noted above, the transition from the ST segment to the T-wave should be smooth. The T-wave is normally slightly asymmetric since its downslope (second half) is steeper than its upslope (first half). Women have a more symmetrical T-wave, a more distinct transition from ST segment to T-wave and lower T-wave amplitude. The T-wave should be concordant with the QRS complex, meaning that a net positive QRS complex should be followed by a positive T-wave, and vice versa (Figure 17). Otherwise there is discordance (opposite directions of QRS and T) which might be due to pathology. A negative T-wave is also called an inverted T-wave.
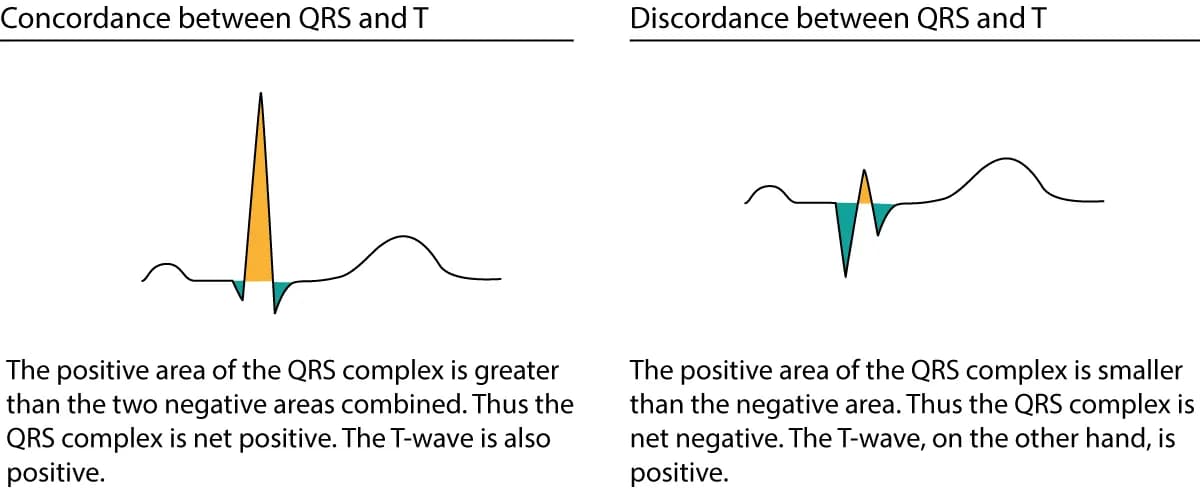 Figure 17. Discordance and concordance between QRS and ST-T.
T-wave changes are notoriously misinterpreted, particularly inverted T-waves. Below follows a discussion which aims to clarify some of the common misunderstandings. All T-waves are illustrated in Figure 18.
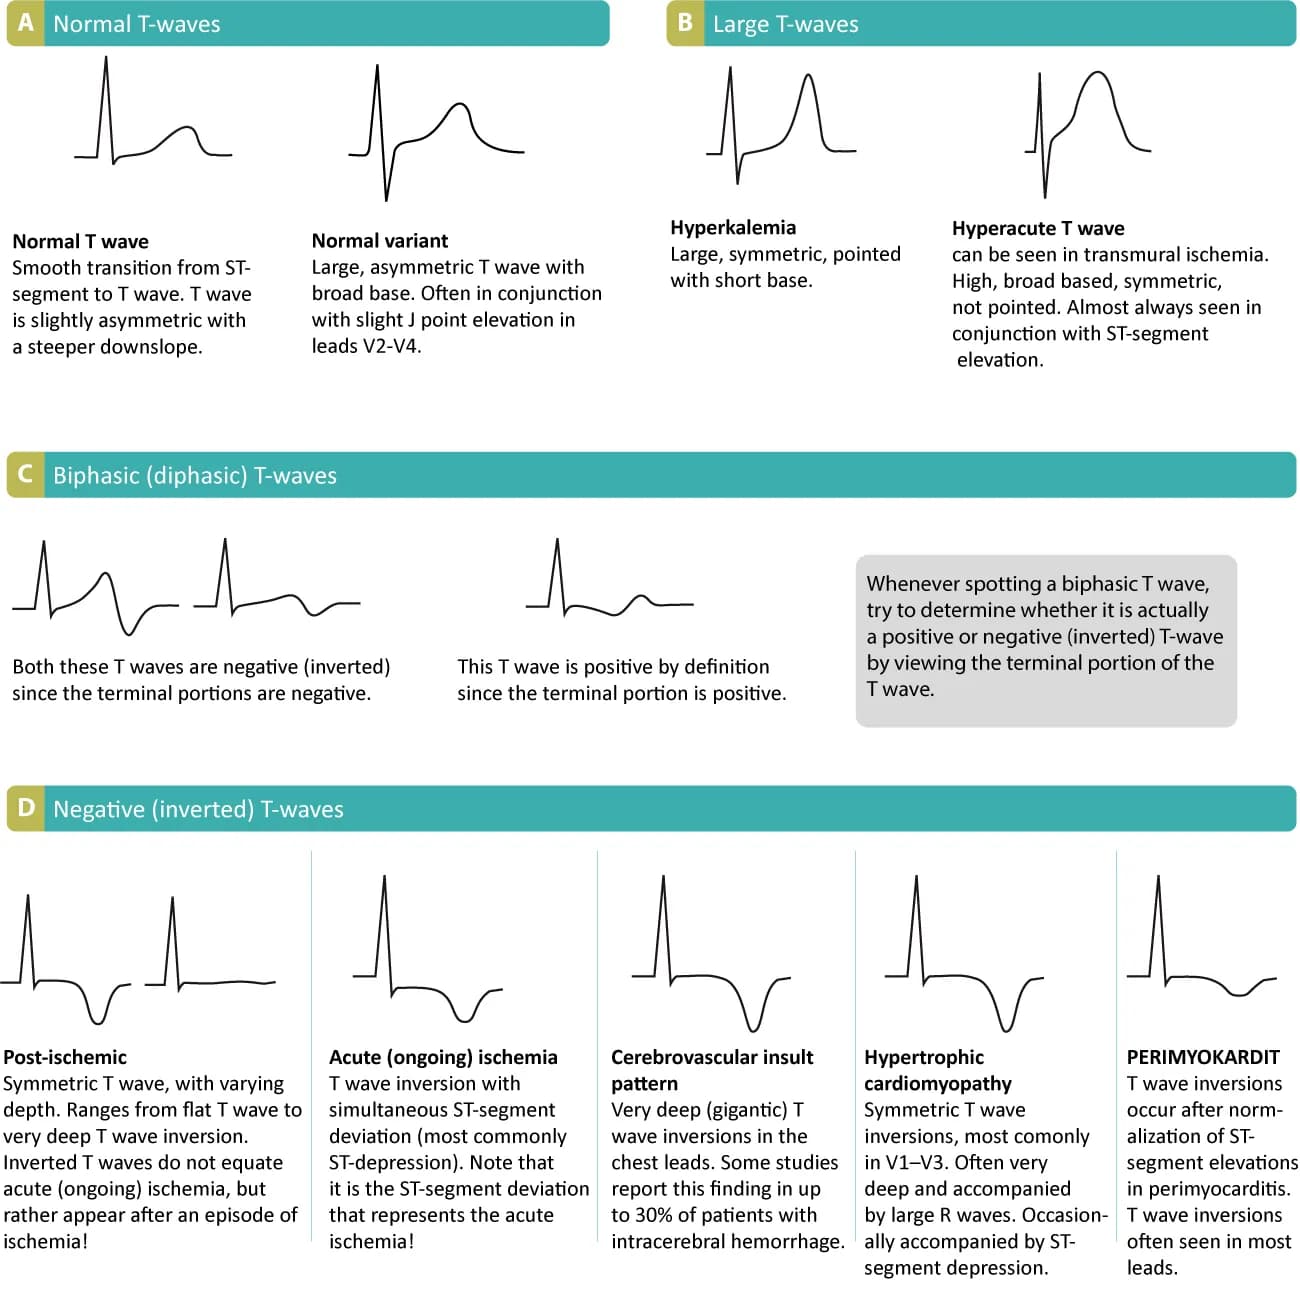 Figure 18. Normal and pathological T-waves.
Positive T-waves
Positive T-waves are rarely higher than 6 mm in the limb leads (typically highest in lead II). In the chest leads the amplitude is highest in V2–V3, where it may occasionally reach 10 mm in men and 8 mm in women. Usually, though, the amplitude in V2–V3 is around 6 mm and 3 mm in men and women, respectively. T-waves that are higher than 10 mm and 8 mm, in men and women, respectively, should be considered abnormal. A common cause of abnormally large T-waves is hyperkalemia, which results in high, pointed and asymmetric T-waves. These must be differentiated from hyperacute T-waves seen in the very early phase of myocardial ischemia. Hyperacute T-waves are broad based, high and symmetric. Their duration is short; they typically disappear within minutes after a total occlusion in a coronary artery occurs (then of course, the ST segment will be elevated).
T-wave inversion (inverted / negative T-waves)
T-wave inversion means that the T-wave is negative. The T-wave is negative if its terminal portion is below the baseline, regardless of whether its other parts are above the baseline. T-wave inversions are frequently misunderstood, particularly in the setting of ischemia.
Normal T-wave inversion
An isolated (single) T-wave inversion in lead V1 is common and normal. It is generally concordant with the QRS complex (which is negative in lead V1). Isolated T-wave inversions also occur in leads V2, III or aVL. In any instance, one must verify whether the inversion is isolated, because if there is T-wave inversion in two anatomically contiguous leads, then it is pathological.
T-wave inversion in myocardial ischemia
Ischemia never causes isolated T-wave inversions. It is a general misunderstanding that T-wave inversions, without simultaneous ST-segment deviation, indicate acute (ongoing) myocardial ischemia. T-wave inversions without simultaneous ST-segment deviation are not ischemic! However, T-wave inversions that are accompanied by ST-segment deviation (either depression or elevation) is representative of ischemia (but in that scenario, it is actually the ST-segment deviation that signals that the ischemia is ongoing). Then one might wonder why T-wave inversions are included as criteria for myocardial infarction. This is explained by the fact that T-wave inversions do occur after an ischemic episode, and these T-wave inversions are referred to as post-ischemic T-waves. Such T-waves are seen after periods of ischemia, after infarction and after successful reperfusion (PCI).
Post-ischemic T-wave inversion is caused by abnormal repolarization. These T-wave inversions are symmetric with varying depth. They may be gigantic (10 mm or more) or less than 1 mm. Negative U-waves my occur when post-ischemic T-wave inversions are present. T-wave inversions may actually become chronic after myocardial infarction. Normalization of T-wave inversion after myocardial infarction is a good prognostic indicator. Please refer to Figure 37.
Secondary T-wave inversion
Secondary T-wave inversions – similar to secondary ST-segment depressions – are caused by bundle branch block, pre-excitation, hypertrophy and ventricular pacemaker stimulation. T-wave inversions that are secondary to these conditions are typically symmetric and there is simultaneous ST-segment depression. Note that the T-wave inversion may actually persist for a period after normalization of the depolarization (if it occurs). This is referred to as T-wave memory or cardiac memory. Secondary T-wave inversions are illustrated in Figure 19 (as well as Figure 18 D).
 Figure 19. Secondary T-wave inversions.
Flat T-waves
T-waves with very low amplitude are common in the post-ischemic period. They are commonly seen in leads V1–V3 if the stenosis/occlusion is located in the left anterior descending artery. If the stenosis/occlusion is located in the left circumflex artery or right coronary artery, the flat T-waves are seen in leads II, aVF and III.
Biphasic (diphasic) T-waves
A biphasic T-wave have a positive and a negative deflection (Figure 37, panel C). It should be noted that the term "biphasic" is unfortunate because (1) biphasic T-waves carry no particular significant and (2) a T-wave is classified as positive or inverted based on its terminal portion; if the terminal portion is positive then the T-wave is positive and vice versa. Thus, a biphasic T-wave should be classified accordingly.
The T-waves in children and adolescents
The T-wave vector is directed to the left, downwards and to the back in children and adolescents. This explains why these individuals display T-wave inversions in the chest leads. T-wave inversions may be present in all chest leads. However, these inversions are normalized gradually during puberty. Some individuals may display persisting T-wave inversion in V1–V4, which is called persisting juvenile T-wave pattern. If all T-waves persist inverted into adulthood, the condition is referred to as idiopathic global T-wave inversion.
T-wave progression
T-wave progression follows the same rules as R-wave progression (see earlier discussion).
T-wave checklist
- I, II, -aVR, V5 and V6: should display positive T-waves in adults. aVR displays a negative T-wave.
- III and aVL: These leads occasionally display an isolated (single) T-wave inversion.
- aVF: positive T-wave, but occasionally flat.
- V1: Inverted or flat T-wave is rather common, particularly in women. The inversion is concordant with the QRS complex.
- V7–V9: should display a positive T-wave.
This article is part of the comprehensive chapter: How to read and interpret the normal ECG
The electrical axis of the heart (heart axis): ECG & physiology
The electrical axis of the heart (heart axis) Although often ignored, assessment of the electrical axis is an integral part of ECG interpretation. The electrical axis reflects the…
The ST segment: physiology, normal appearance, ST depression & ST elevation
The ST segment: physiology, normal appearance, ST depression ST elevation The ST segment corresponds to the plateau phase of the action potential ( Figure 13 ). The ST segment…