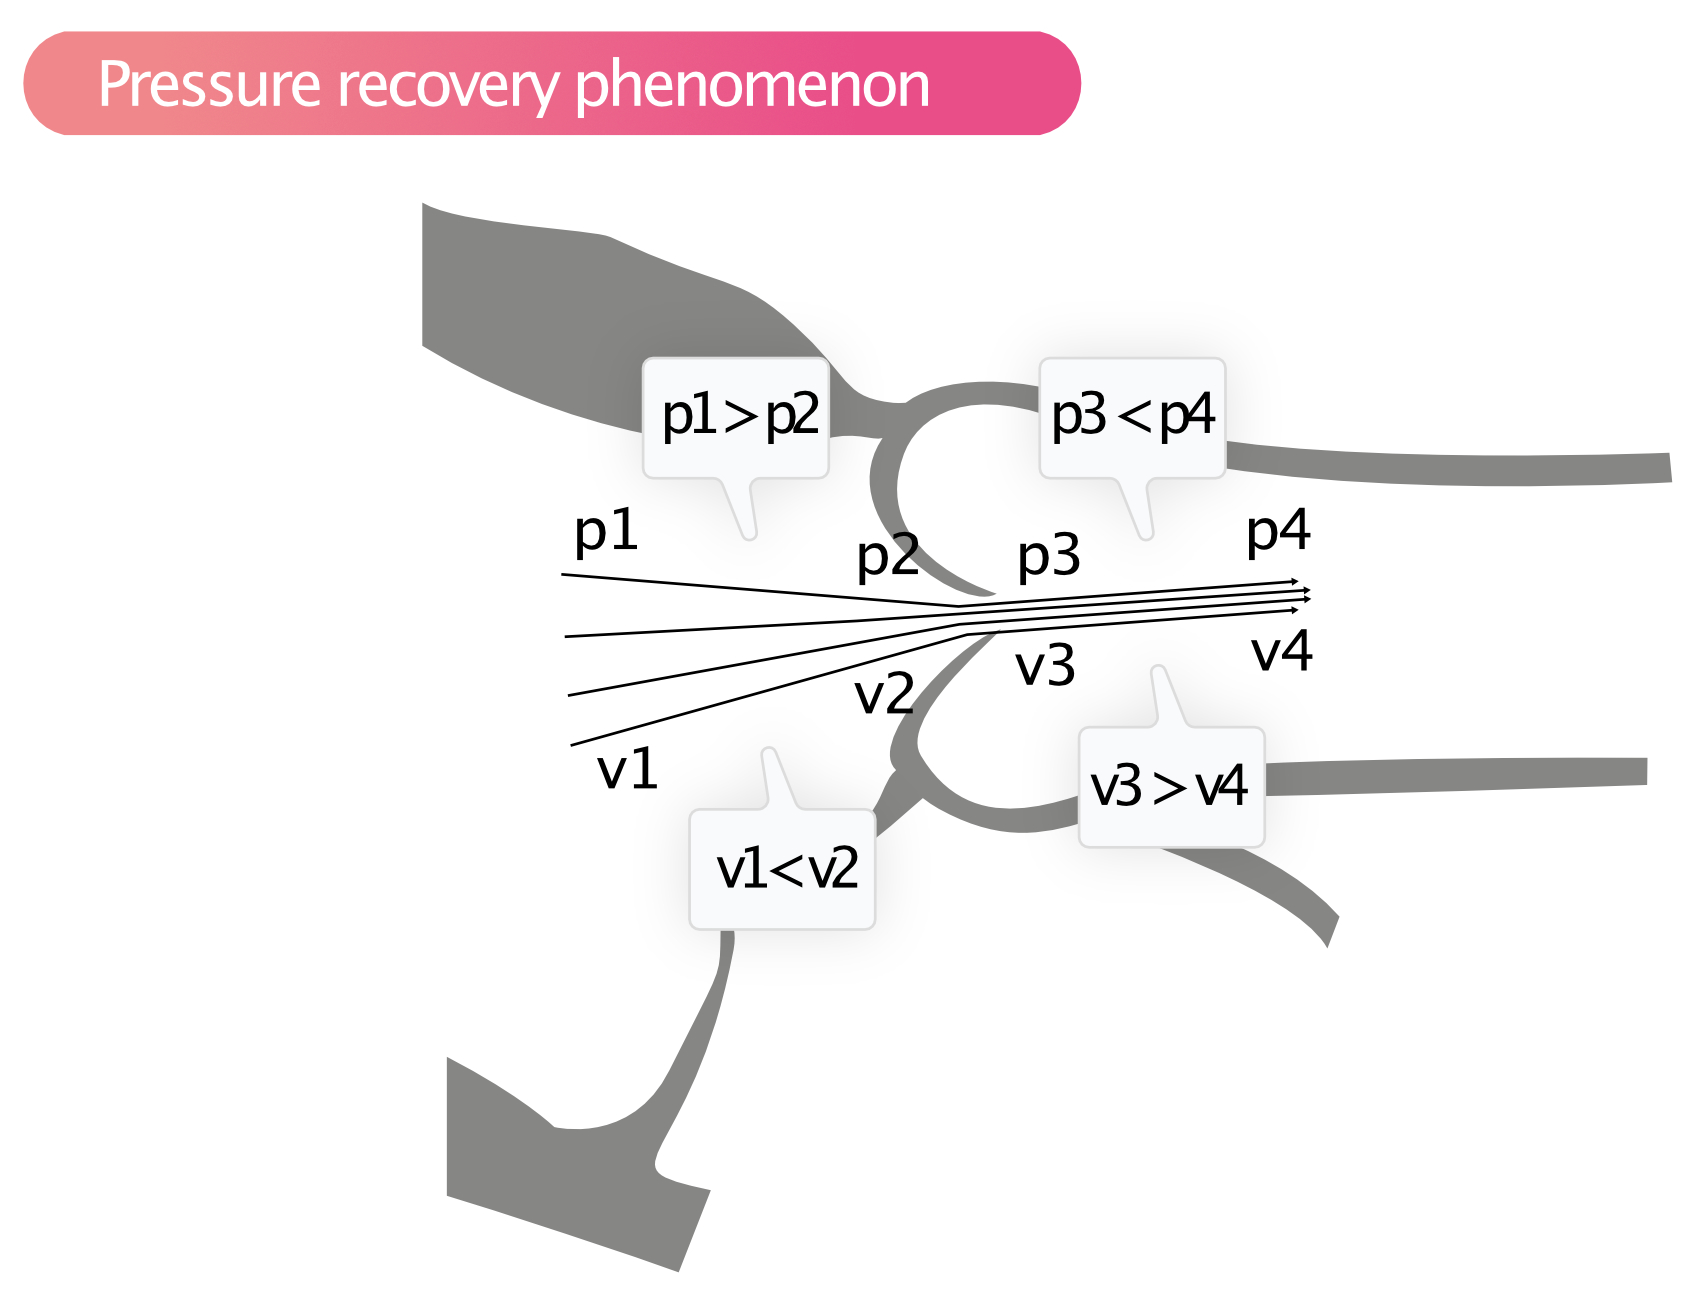
Figure 6. Pressure recovery phenomenon. The pressure falls between p1 and p2, but then increases between p3 and p4. The pressure measured in the aorta with continuous wave Doppler is p3, which is thus lower than p4. So the pressure in the aorta is higher than the measurement with Doppler suggests.