
Figure 1. The ECG grid. The x-axis represents time and y-axis represents amplitude of the electrical signals generated in the myocardium. The same ECG grid is used in children and adult patients.
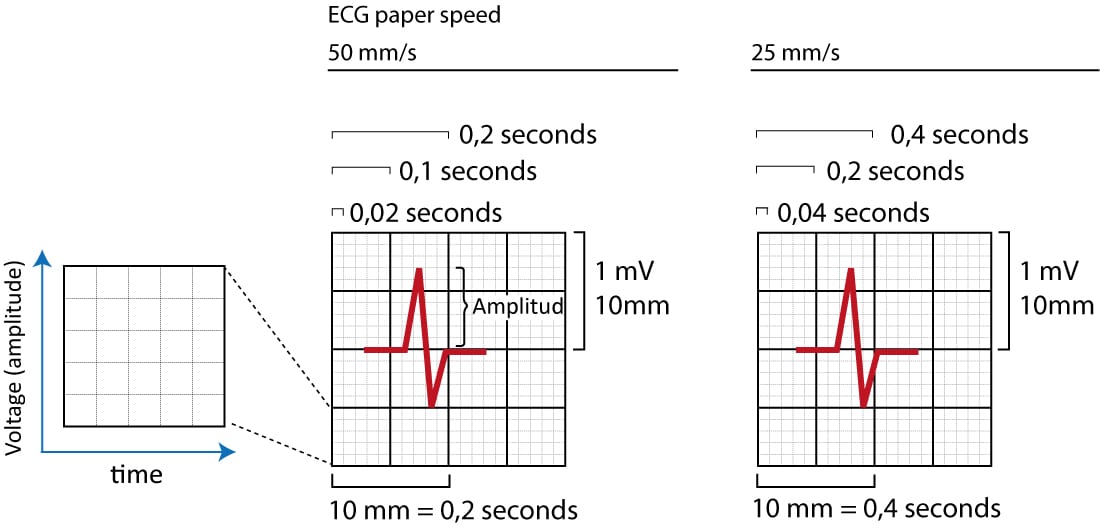


Figure 1. The ECG grid. The x-axis represents time and y-axis represents amplitude of the electrical signals generated in the myocardium. The same ECG grid is used in children and adult patients.