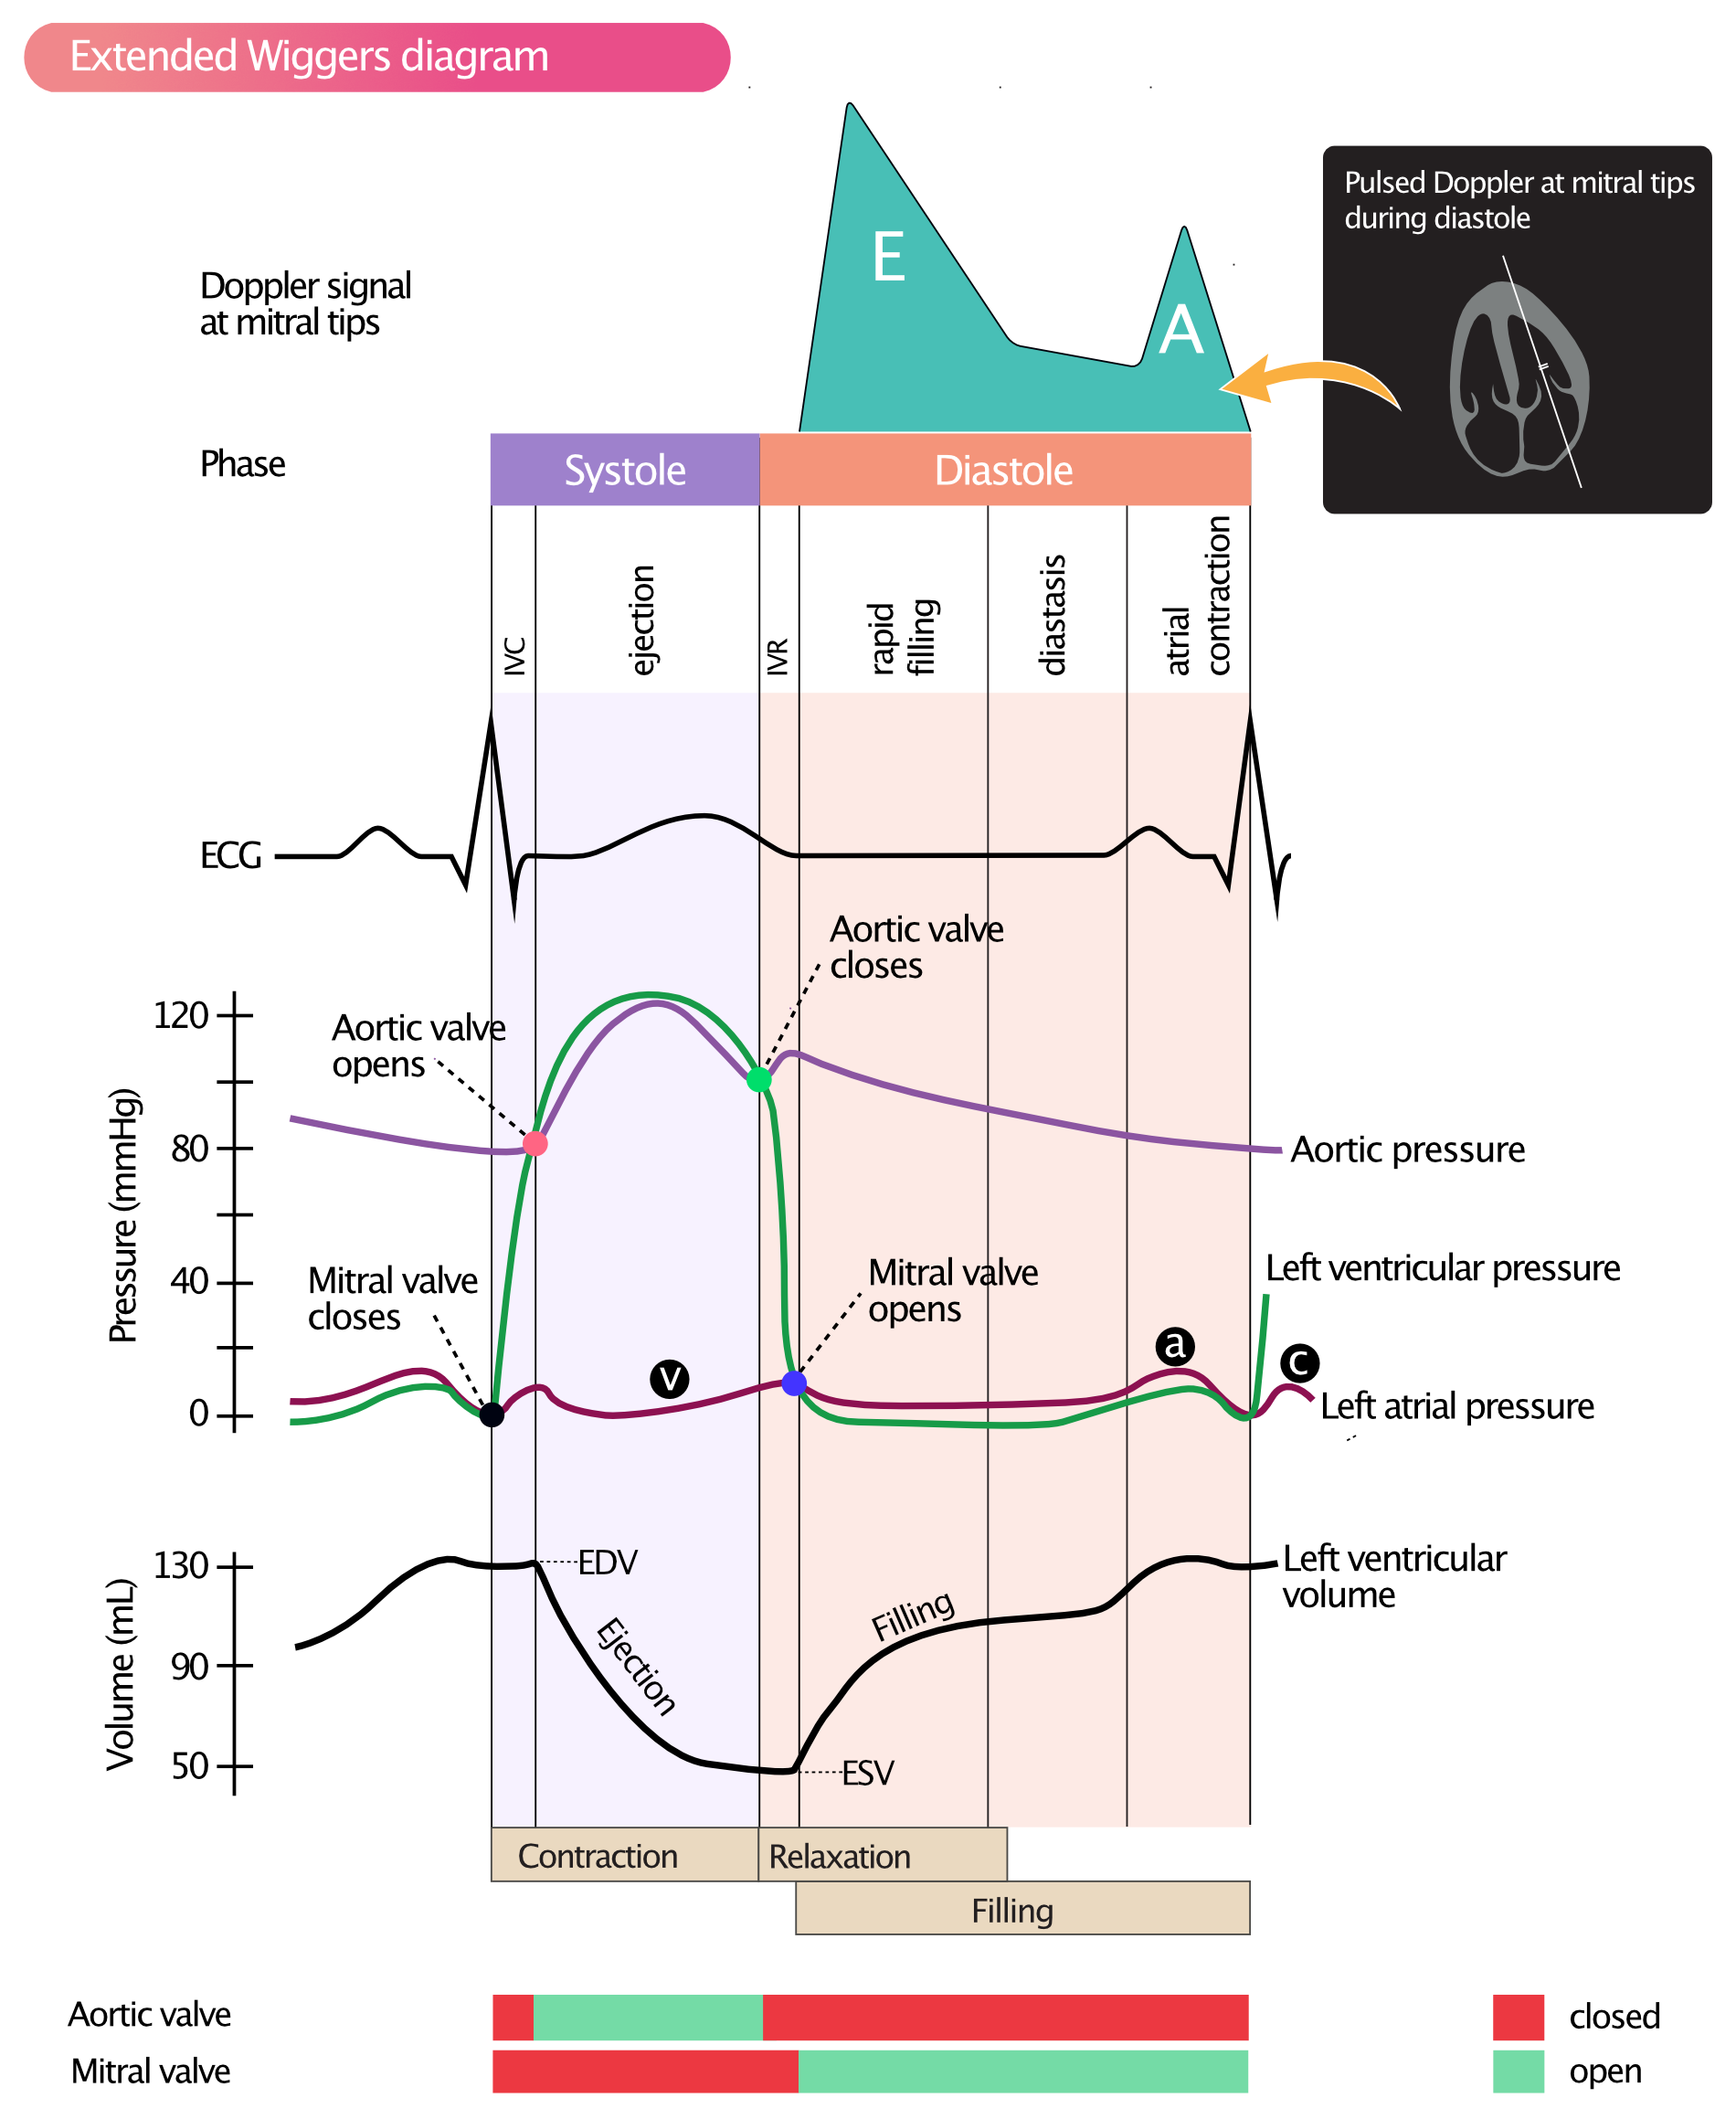
Figure 2. Wiggers diagram showing pressure, volume, Doppler signal, ECG and AV valves during the cardiac cycle. Doppler recording of mitral valve flow during diastole. (a) = active atrial filling; (b) = increased atrial pressure due to bulging of mitral valve into the left atrium, when valve closes; (c) = passive atrial filling.